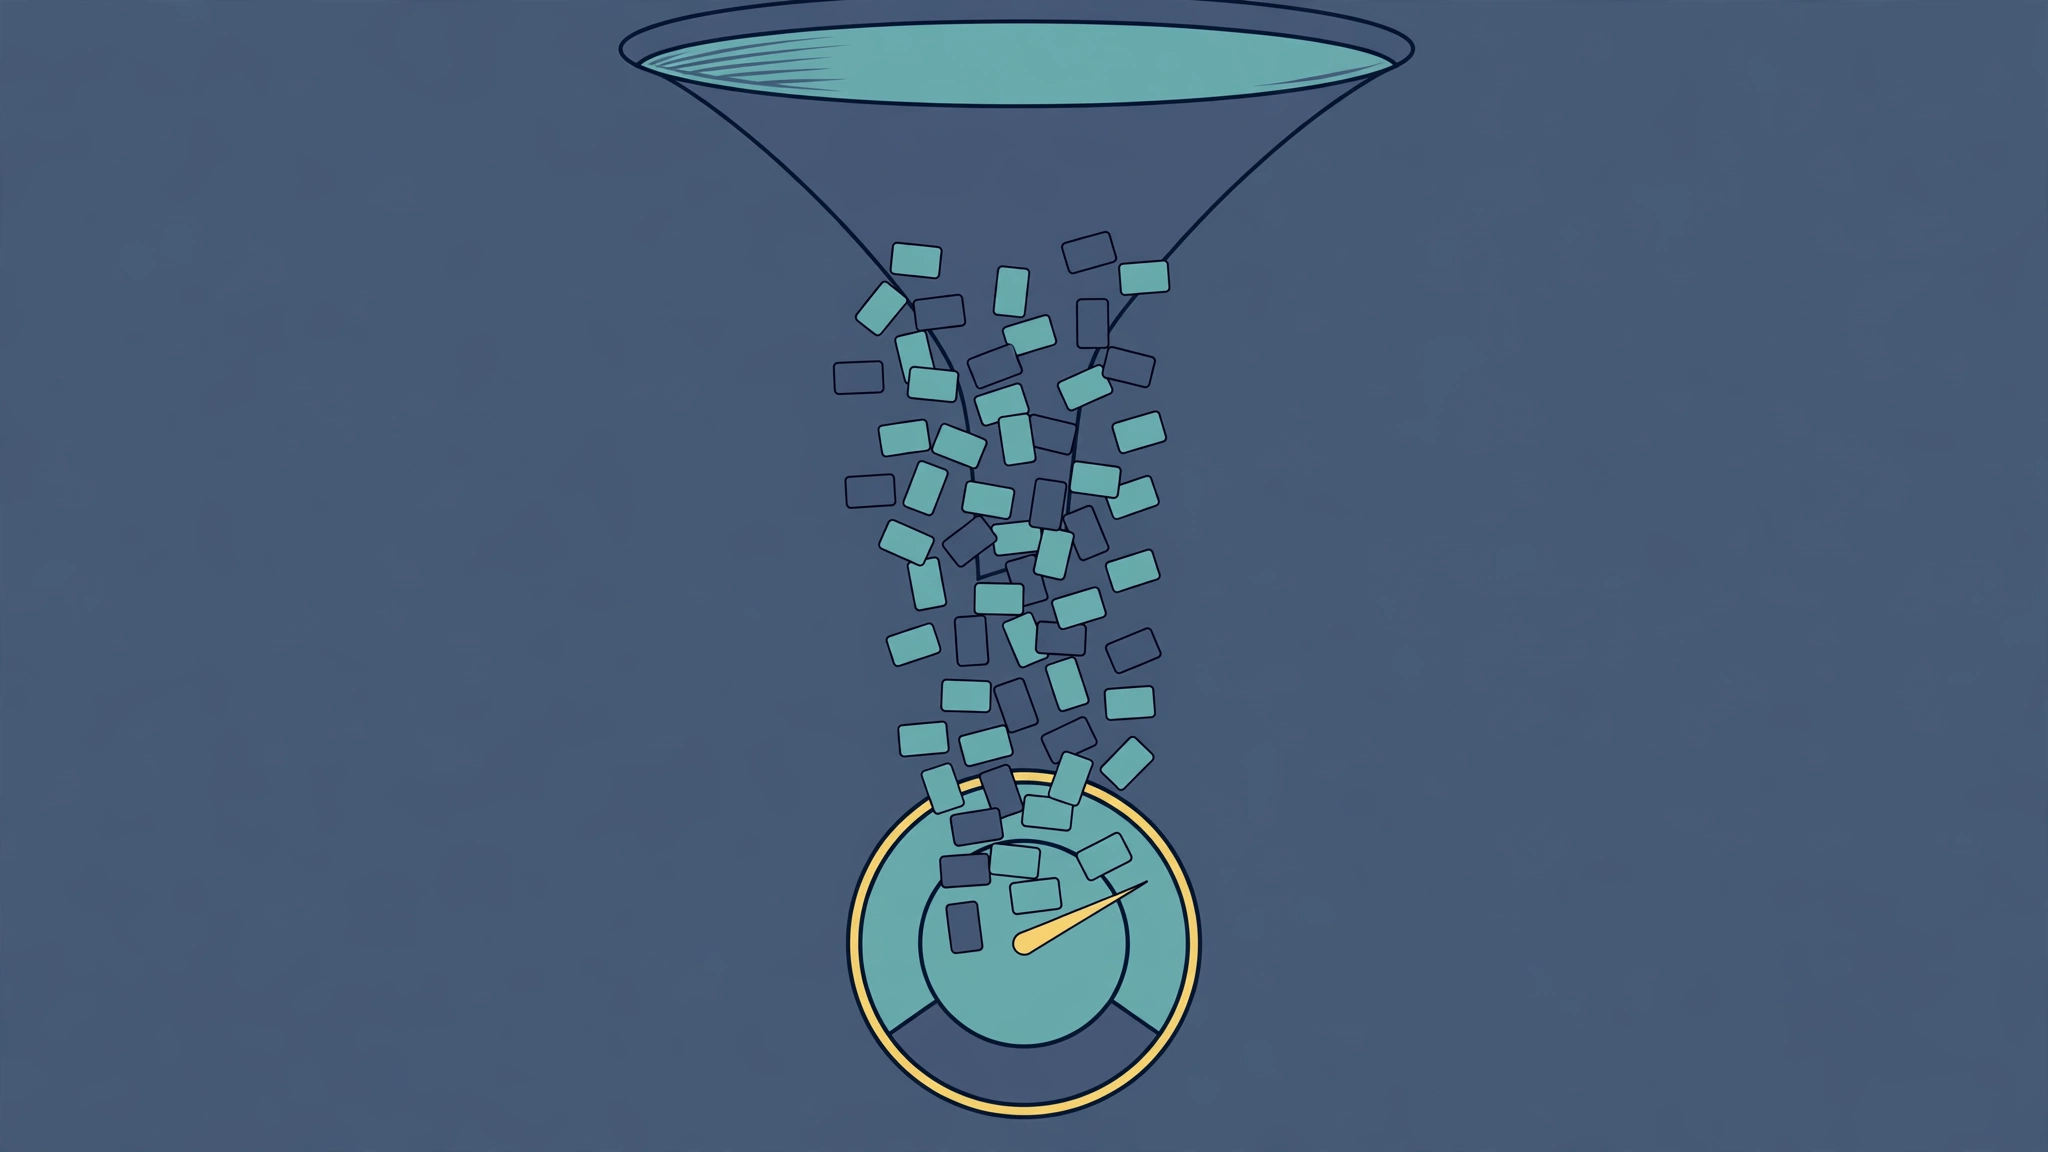
A credit score is calculated in 5 computation stages: the model extracts 1 bureau file, codes every tradeline by status, measures the 5 factor categories from the coded data, applies the model weights to the measurements, and maps the result onto the score scale. FICO publishes the 5 category weights for the general population — payment history 35 percent, amounts owed 30 percent, length of credit history 15 percent, new credit 10 percent, and credit mix 10 percent — and Fair Isaac Corporation publishes no formula. The exact output of a specific file therefore exists only inside the model run at pull time. A credit score is a 3-digit number a scoring model calculates from credit report data, and the pipeline that delivers the file to the model sits on the mechanism page of this cluster (internal link: F0392, “How does a credit score work?”).
Which data enters the calculation?
Five data groups enter the calculation from the extracted file: account balances, credit limits and original loan amounts, account open dates, payment statuses, and inquiry records. The model reads 1 file from 1 bureau per run, so a calculation on Experian data uses only the tradelines Experian holds. Each data group feeds defined categories, and the table states the routing once.
| Data group in the file | Categories the data feeds |
|---|---|
| Payment status per tradeline | Payment history |
| Balances, limits, original loan amounts | Amounts owed |
| Open dates and last activity dates | Length of credit history |
| Inquiry records and recent open dates | New credit |
| Account type codes | Credit mix, and amounts owed by type |
Income, employment, and deposit balances enter no row of the table: the calculation runs on credit behavior data alone, and a lender reads income separately inside underwriting. Public-record items within the limits of the Fair Credit Reporting Act (FCRA), a bankruptcy as the standard example, enter through the payment status group as derogatory records.
How does the model code each account before measuring?
The model codes every tradeline into a standard status before any measurement: current, 30 days late, 60 days late, 90 days late, 120 or more days late, charged off, or in collection. Coding converts furnisher reports in the Metro 2 format into uniform values, so a late payment at a card issuer and a late payment at an auto lender enter the measurement stage in the same units. A tradeline carries 1 current status and a status history, and the calculation reads both.
For derogatory data, FICO documentation names 3 measurement dimensions: severity, recency, and frequency. Severity measures how late a payment ran, on the scale from 30 days to charge-off. Recency measures the months since the most recent late mark. Frequency counts the number of accounts and items carrying late marks. A 30-day late payment 40 months old and a 90-day late payment 2 months old differ on all 3 dimensions, and the second pattern enters as the heavier negative input.
How is each of the 5 categories measured?
Each category converts coded tradeline data into measurements, and FICO publishes both the measurement lists and the category weights for the general population. The weights sum to 100 percent: 35 plus 30 plus 15 plus 10 plus 10. The table states the measurements per category once, from FICO documentation.
| Category | FICO weight, general population | Measurements the model computes |
|---|---|---|
| Payment history | 35% | Status per account type, severity of late marks, recency of late marks, number of accounts with late marks |
| Amounts owed | 30% | Total balances, per-account utilization, overall utilization, number of accounts with balances, proportion of an installment balance remaining |
| Length of credit history | 15% | Age of the oldest account, average age of all accounts, age by account type, time since last account activity |
| New credit | 10% | Accounts opened in the past 12 months, hard inquiries in the past 12 months, time since the newest opening, re-establishment of positive history after problems |
| Credit mix | 10% | Account types present: revolving cards, retail accounts, installment loans, mortgage loans, consumer finance accounts |
Utilization carries a full public arithmetic. Per-account utilization equals balance divided by limit: $2,400 on $10,000 gives 24 percent. Overall revolving utilization equals total revolving balances divided by total revolving limits. The installment proportion equals the remaining balance divided by the original loan amount: $6,000 remaining on $12,000 gives 50 percent. The Credit Utilization Calculator computes the 2 utilization figures from entered balances and limits (internal link: R04-C01, “Credit Utilization Calculator”).
This table states how the model measures; the factors pillar explains what each measurement means, factor by factor and topic by topic (internal link: R04-P06, “What Affects Your Credit Score?”). The weights describe the general population in FICO documentation, and FICO states that category importance varies by consumer profile, so a thin file and a 20-year file run through different effective weightings inside the same model.
What does a worked measurement example compute?
A worked example computes the measurements of 1 file in full, and the example stops at the measurement stage, because no published formula converts measurements into a score. The example is illustrative: the file is hypothetical, and every result below is arithmetic on the stated inputs. The file holds 3 accounts: revolving card A with a $2,400 balance on a $10,000 limit, opened 96 months ago, with 1 late payment of 30 days recorded 14 months ago; revolving card B with a $0 balance on a $5,000 limit, opened 48 months ago, with no late marks; and an installment loan with $6,000 remaining on an original $12,000 balance, opened 24 months ago, with no late marks. The file also holds 2 hard inquiries in the past 12 months.
| Measurement | Inputs | Result |
|---|---|---|
| Per-account utilization, card A | $2,400 ÷ $10,000 | 24% |
| Per-account utilization, card B | $0 ÷ $5,000 | 0% |
| Overall revolving utilization | $2,400 ÷ $15,000 | 16% |
| Installment proportion remaining | $6,000 ÷ $12,000 | 50% |
| Accounts with balances | Cards A + installment loan, of 3 accounts | 2 of 3 |
| Oldest account age | Card A open date | 96 months |
| Average account age | (96 + 48 + 24) ÷ 3 | 56 months |
| Newest account age | Installment loan open date | 24 months |
| Hard inquiries, past 12 months | File inquiry records | 2 |
| Derogatory items | Card A, 30 days late, 14 months old | 1 item |

The insight after the table is the boundary of public knowledge: every figure in the result column is exact and reproducible, and the next stage — the conversion of these 10 measurements into 1 number between 300 and 850 — runs through weighting formulas Fair Isaac Corporation holds as proprietary. A page or service that prints an exact score for this file is estimating, and the estimate carries no model authority.
How do trended-data models change the calculation?
Trended-data models change the input window of the calculation from a point-in-time snapshot to a trajectory of 24 months or longer, inside the same 5 categories. FICO Score 8 and VantageScore 3.0 read the file as it stands at pull time: current balance, current status, current utilization. FICO Score 10T, launched in 2020, and VantageScore 4.0, launched in 2017, read the direction of the data over time: a balance falling month over month and a balance rising month over month produce different measurements from the same current balance. Amounts owed gains the most from the wider window: a trajectory separates a consumer who pays balances down from a consumer who accumulates balances at an identical snapshot figure.
The stage structure survives intact: extraction, coding, measurement, weighting, and mapping run in the same order in all 4 versions; only the measurement inputs widen. A utilization figure of 24 percent enters a snapshot model as 24 percent, and enters a trended model as 24 percent with a 24-month direction attached. Version taxonomy sits on the types page (internal link: F0393, “What are the types of credit score?”).
How does the calculation produce the scale value and the reason codes?
The final stage maps the weighted result onto the model scale — 300 to 850 for general-purpose scores — and ranks the negative measurements into up to 4 or 5 reason codes. The mapping is monotonic: stronger measurements map to higher values on the scale, and the scale endpoints anchor the output, so no calculation returns a value below 300 or above 850 on a general-purpose model. Industry-specific FICO Scores map onto 250 to 900 instead, and the classification of scales belongs to the types page (internal link: F0393, “What are the types of credit score?”).
The model orders the measurements that pulled the result down most strongly — a high utilization ratio and a recent 60-day delinquency are standard examples — and emits the top entries as codes with short text descriptions. A lender receives the score and the codes together in 1 response, and the delivery and decision use of that response sit on the mechanism page (internal link: F0392, “How does a credit score work?”). A consumer reading the codes reads the ranking itself: the first code names the heaviest negative measurement in the run.
Why does no source publish exact points per action?
No source publishes exact points per action because the conversion formulas are trade secrets of Fair Isaac Corporation and VantageScore Solutions LLC, and both companies publish weights, categories, and measurement lists instead of point tables. FICO documentation gives the general-population weights — 35, 30, 15, 10, and 10 percent — and states that category importance varies by consumer profile. A point value for a 30-day late payment therefore varies across files inside the model design itself: the same late mark enters a file with 20 years of clean history and a file with 3 prior late marks at different effective weights. A single universal point figure contradicts the published structure of the model, and any exact figure in a blog post, a video, or a credit repair pitch is an estimate built from observed score changes on individual files.
The Consumer Financial Protection Bureau (CFPB) documents the consequence in its September 2012 study of consumer-purchased and lender-used scores: scores differ across models, versions, and bureau files for the same consumer on the same day. The calculation is exact inside each model run and non-reproducible outside it. The reliable public layer is the measurement layer: utilization percentages, account ages, inquiry counts, and status codes, each computable from the file with the arithmetic shown above.
Frequently asked questions
Does FICO publish its calculation formula?
No, FICO publishes the 5 category weights and the measurement lists, and the formula that converts measurements into a score stays proprietary to Fair Isaac Corporation. The same boundary holds at VantageScore Solutions. Public documentation ends at the measurement stage.
How is credit utilization calculated inside the score?
Utilization is calculated per account as balance divided by limit, and overall as total revolving balances divided by total revolving limits: $2,400 on $10,000 gives 24 percent per account. Both figures enter amounts owed, from the balance in the last furnisher report.

How is the average age of accounts calculated?
Average age equals the sum of every account age in months divided by the number of accounts: (96 + 48 + 24) divided by 3 gives 56 months in the worked example of this page. The oldest account age enters separately. Both figures feed the length of credit history category.
How does the model measure an installment loan in the calculation?
The model measures an installment loan as a proportion: the remaining balance divided by the original loan amount, so $6,000 remaining on a $12,000 loan gives 50 percent remaining. A lower proportion signals more of the loan repaid. The figure enters the amounts owed category beside utilization.
How far back does a trended-data calculation read?
FICO Score 10T and VantageScore 4.0 read trended data over 24 months or longer, against the pull-time snapshot in FICO Score 8 and VantageScore 3.0. The window widens the measurement inputs inside the same 5 categories. Balance direction over time becomes a scored measurement.
How many points does a 30-day late payment cost?
No published source states an exact point cost for a 30-day late payment, because FICO and VantageScore publish no point tables and the effect varies by the rest of the file. The mark enters the payment history measurement on severity, recency, and frequency. Exact point claims from third parties are estimates.
Does a recent late payment count more than an old one in the calculation?
Yes, recency is 1 of the 3 published payment history measurement dimensions, with severity and frequency, so a late mark from 2 months ago enters the measurement as a heavier negative input than an identical mark from 40 months ago. FICO publishes the dimensions, not point values.
Why does the same file produce different scores in 2 models?
Two models produce different scores from 1 file because each model applies its own weights, its own measurement definitions, and its own scale mapping to the same coded data. FICO and VantageScore are separate formulas from separate companies. The file is identical; the calculation is not.
Summary
A credit score is calculated in 5 computation stages — extraction, coding, measurement, weight application, and scale mapping — and the public layer of the calculation is the measurement layer: utilization at 24 percent on a $2,400 balance against a $10,000 limit, an average account age of 56 months across 3 accounts, 2 hard inquiries in 12 months, each figure reproducible from the file with the arithmetic on this page. The conversion of measurements into the final number runs inside proprietary formulas at FICO and VantageScore Solutions, and no published point table exists for any single action. The previous page of this cluster states the file conditions a calculation requires before stage 1 runs (internal link: Credit score, “What are the requirements and eligibility rules for credit score?”), and the next page compares the credit score concept against the FICO Score directly (internal link: Credit score, “Credit score vs FICO Score: differences, costs, and benefits”).




Pingback: Credit score vs FICO Score - Fiscal Primer